Now that’s what I call a speed-up
Tuesday, May 29th, 2007CPU Usage 0.4 creates and throws away an NSImage every time a view (one per processor) updates. This is incredibly wasteful: The application uses about 0.7% of a CPU on my system.
But I decided that I can make that faster. Profiling (thanks, Shark!) revealed that the hot spot was creating, measuring, drawing, and throwing away the attributed string that goes into the NSImage. That’s not hard to optimize away: as the old doctor joke goes, “stop doing that”.
So I created a couple of branches, and went in two different directions:
- Direction A uses NSLayoutManager—specifically, one NSTextStorage, one NSLayoutManager, and one NSTextContainer for every (CPU, percentage) pair. A view can display any of 101 percentages (0–100%), so on my four-core system, this branch creates 404 storages, 404 managers, and 404 containers.
- Direction B uses an NSImage, just like 0.4 does, but keeps it around.
Both branches are written to create the (NSImage|NSTS, NSLM, and NSTC) lazily, but for testing, I added this code to force the creation of all the cached objects up front so that my time-trials would represent normal usage (that is, usage after all the objects have been created and cached):
- (void)drawRect:(NSRect)rect {
    //BEGIN TEMP
    if(!(percentageImages[0U])) {
        static BOOL isInDrawRect;
        if(!isInDrawRect) {
            isInDrawRect = YES;

            NSLog(@"Preloading percentage images for CPU %u", CPUNumber);
            NSRect tempImageBounds = [self bounds];
            NSImage *tempImage = [[NSImage alloc] initWithSize:tempImageBounds.size];
            [tempImage lockFocus];
            for(float usage = 0.0f, maxUsage = 1.01f; usage < maxUsage; usage += 0.01f) {
                [self setCPUUsage:usage];
                [self drawRect:tempImageBounds];
            }
            [tempImage unlockFocus];
            [tempImage release];
            NSLog(@"Done preloading percentage images for CPU %u", CPUNumber);

            isInDrawRect = NO;
        }
    }
    //END TEMP

    ⋮
    (The rest of -drawRect: is here)
}
That’s from the NSImage branch, but the code in the NSLayoutManager branch is basically the same. (Note: tempImage is not the cached image; it’s just a throwaway destination for the drawing done by -drawRect: in the inner call.)
Once I had finished this, and fully optimized both branches using Shark, the next step was to try them out and see how they fare.
I launched all three versions of CPU Usage, and then did the following:
# Watch the CPU usage of the CPU Usage processes for five minutes (300 seconds)
top -l 300 | fgrep 'CPU Usage' > top-CPU_Usage.txt      %/Volumes/RAM Disk(130)
___
# Fourth column (as determined by whitespace) is CPU usage
fgrep 221 < top-CPU_Usage.txt  | awk '{ print $4; }' > top-CPU_Usage-0.4.txt
___
fgrep 1121 < top-CPU_Usage.txt | awk '{ print $4; }' > top-CPU_Usage-NSLM.txt
___
fgrep 1118 < top-CPU_Usage.txt | awk '{ print $4; }' > top-CPU_Usage-NSImage.txt
___
# The results, in percent of one CPU
~/Python/avg.py < top-CPU_Usage-0.4.txt                   %/Volumes/RAM Disk(0)
0.671
___
~/Python/avg.py < top-CPU_Usage-NSLM.txt                  %/Volumes/RAM Disk(0)
0.667
___
~/Python/avg.py < top-CPU_Usage-NSImage.txt               %/Volumes/RAM Disk(0)
0.737
Note: For timing purposes (since top’s CPU-usage display is in tenths of a second), I divided CPU Usage’s sample interval by ten. Normally, it samples every 0.5 sec; the two prototypes above sample every 0.05 second (that is, ¹⁄₂₀ sec instead of ¹⁄₂ sec).
This means that to compare them to 0.4, you must divide the results by ten to adjust them back to the half-second interval that a release would have. Here are the *real* results:
| 0.4 | 0.671% |
|---|---|
| NSImage | 0.0737% |
| NSLayoutManager | 0.0667% |
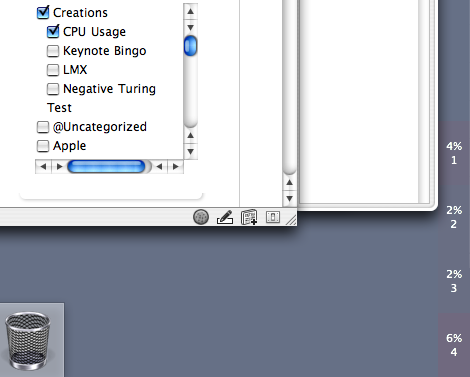
So CPU Usage 0.5, with the cached-NSLayoutManager behavior, will use ¹⁄₁₀ as much CPU as 0.4 does. And here’s what that looks like:
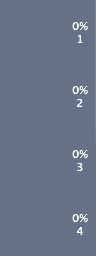
Sweet!